


QlikView dashboards can sometimes become very heavy.
The size of the dashboard depends upon the number of Sheets, number of Objects, Calculation time and Memory utilization of objects in a QVW.
You should analyze QlikView dashboard to evaluate the performance of the qvw.
Another reason to analyze the dashboard is to gain understanding of the dashboard. Your dashboard may have many objects and these objects may have ” ShowMode” as Normal,Minimized,Maximized, hidden or has a show condition. If you inherit a dash board developed by some other developer then analyzing dashboard will help you in gaining insights into the dashboard.
Analyze your Dashboard for perfromance
Document properties: Sheets
The most important property for analyzing your dashboard is Document properties.
Navigate to Settings/Document properties – sheet tab. Sheet tab is very useful in analyzing your dashboard.
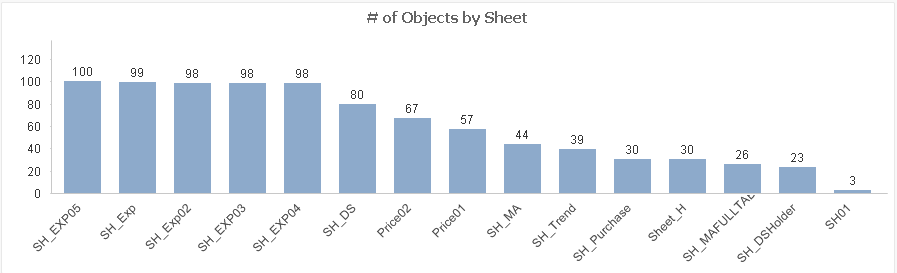
This tab helps to keep track of every sheet and sheet object of the QlikView document. This dialog page consists of two lists, the Sheets list and the Sheet Object lists.

You can export this structure into set of text files. These exported text files will be for Sheet and Sheet Objects. The files will be exported as filename.Sheets.tab and filename.Objects.tab.
You can load these text files into QlikView to perform detail analysis.


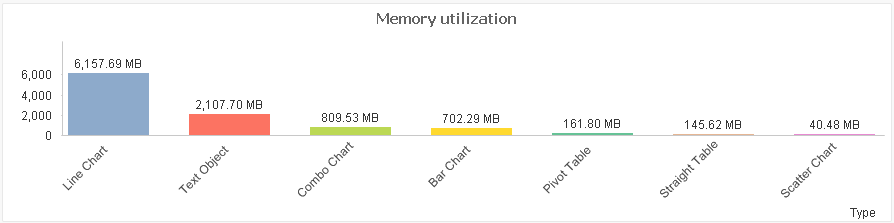
Note : Calc Time of the Object is in milliseconds and it is relevant for objects that are calculated i.e. charts,Table boxes and any objects containing formulas.
Memory is in KB and it is relevant for objects that are calculated i.e. charts,Table boxes and any objects containing formulas.
You can create charts using this data for further analysis
Rob Wunderlich has created a very comprehensive QlikView document Analyzer. Please visit the link below to get more details on it.
Further Reading : qlikviewcookbook


 :
: 