


Sometimes your requirement demands that you display charts based on user selection. it is very easy to accomplish this task in QlikView.
Steps to display charts based on selection in QlikView
1. Connect to the data source. In my example i will be loading data from an excel sheet
2. Create an Inline table for the charts you want to display
3. Create two charts – BarChart and a TrendChart
4. Set a condition on the Layout tab of the charts
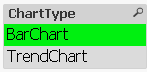
5. Create a list box for chart type selection
As a first step, i will load the data from excel
1. Open QlikView desktop and go to script editor by using ctrl + E
2. From the data section at the bottom,click on Table Files and browse to your file
![]() 3. Click reload to load the data
3. Click reload to load the data
4. On the script editor, add a new tab from the menu and create an Inline table for BarChart and TrendChart.

Creating Bar chart and LineChart
1. Right click on the sheet and select New sheet object and chart.
2. On the General tab,Select Bar chart which is the first chart in Chart Types.
3. Select City as Dimension and expression as Sum(Profit)
4. Navigate to Layout tab and under Show option specify the following condition

6. To create Line Chart, copy the Bar chart by clicking over the chart, press ctrl and drag the chart. You can also use copy paste to make a copy of the chart
7. In the Layout tab of the Line Chart, specify the following condition
ChartType = ‘TrendChart’
- Make sure the spelling of ChartType , BarChart and TrendChart matches exactly what you have defined in the Inline table
8. Create a listbox for ChartType
You dashboard is ready,where based on a selection you can display your charts

Curious to know how to do this in Tableau visit How to display a chart based on selection in Tableau


 :
: