


Aggr() function is a very powerful function in QlikView.
It comes under advanced Aggregation and provides great flexiblity to the developer and user.
What is Aggr( )
- Let you perform Aggregation over a set of dimensions
- It creates kind of a temp table of results from which you can select and perform more aggregations
- Can be used with expressions and dimensions
- Result of Aggr can be used in other aggregated functions
- Similar to Group By clause in SQL
- Similar to chart expression based on different chart dimensions
Understanding Aggr()
1. let us find out the Cost per product per customer in a given month.
We will create this using normal aggregation in a chart with Dimensions as Month,CustomerName and Product with expression as Sum(Cost). We will also create this using Aggr(). Both will give same output
Aggr() expression will look like
Aggr(Sum(Cost),Month,CustomerName,ProductName)
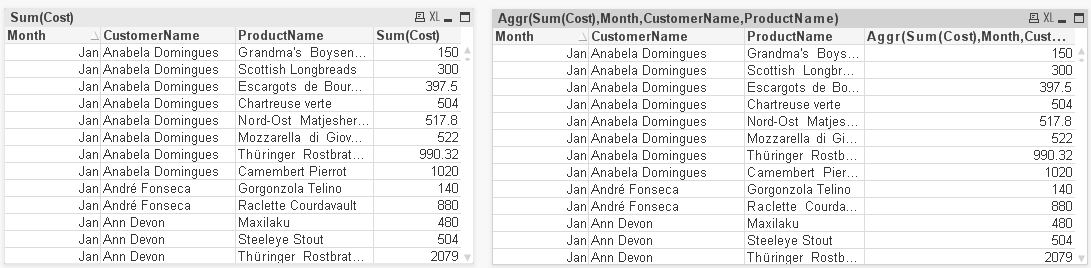
Normal aggregation Sum(Cost) and Advanced Aggr() produce same results.
This is also similar to SQL statement
Select Month, CustomerName, ProductName, Sum(Cost) from myTable
Group By Month,CustomerName,ProductName;
2. To understand more of Aggr(), let us find out Cost of a product for each customer and month and also the maximum Cost for any Customer for the same product and month. In this query, we are discarding Customer dimension to get Maximum cost by Month and Product.
To achieve the above results, we need to first calculate Cost per month,per customer and product and then from this result get the Maximum cost per month and product.
First we will calculate Aggr(Sum(Cost),Month,CustomerName,ProductName)
which is similar to the above output
then we will get the Maximum of this result i.e.
Max(Aggr(Sum(Cost),Month,CustomerName,ProductName))
This calculation will not change the result as Max is also calculating within the dimension of the chart i.e. for Month,Customer and Product but for our requirement we need to calculate Maximum Cost per month and Product
For this we will use Total qualifier with Max.Total qualifier will disregard any or all chart dimension. Since we have to just disregard Customer dimension, we will explicitly state which dimensions we want to include with the Total aggregation. To include Month and ProductName and disregard Customer, our expression will be
Max(Total<Month,ProductName>
Aggr(Sum(Cost),Month,CustomerName,ProductName))
Total<Month,ProductName> – will make sure that in the calculation of Max, Month and ProductName dimensions are included.
Our Output will look like

Summary :
From the above examples, we can see that
– Aggr() function is similar to Group by function in Sql.
– It is also similar to applying aggregation in a chart with set of dimensions.
– The power of Aggr() lies in the fact that it provides a temp table from which you can select the results and apply further aggregation to arrive at meaningful results.
– In the absence of Aggr you may need to write complex scripts or sql queries to achieve similar results.


 :
:
If I have the dimension of customer, and the two measures of Sales value and Date.
How in a table grouped at Customer level can I show the minimum date WHERE the sales value is the maximum, ie the same sales value could repeat across dates and I want the earliest that the max has occured.
I have tried to manipulate an AGGR function but to no avail
so in a table if the Max(Sales) = 500 and it falls on both 1/2/2015 and 1/4/2015 then you want to get 1/2/2015 ?
you can do this in script.
Get the min(Date) group By Sales
Order By Sales desc ,Date asc
This will create a new sorted table.
Then you can get the first row by using Peek()
Very helpful guide with example, thanks a lot Chandraish Sinha for such a lovely sharing.