


It is very important to have dynamic title in your Charts and Expressions because it gives context to your visualization and makes it easy for the users to understand the visualization clearly.
It is very easy in QlikView to achieve this functionality
I will create a simple straight table with some list boxes to show how to create dynamic title in Charts

Straight Table with 2 List boxes. Selection of Year 1997 does not change the Chart title.
Now my objective is to show Chart/Straight table title based on the user selection
To achieve this i will use GetFieldSelections() function.
Syntax of GetFieldSelections() is
getfieldselections ( FieldName [, ValueSep [, MaxValues]])
Returns a string with the current selections in a field.
Expression to create a dynamic title will look like the following :

Now if the user selects a specific Year our Chart title will look like the following.

When user selected Year 1997, it shows up in the title of the table
In the above Table you might have noticed that expression Sum(Freight) does not change with field Selection. You can make expression Lable also dynamic in the similar fashion by using GetFieldSelections()
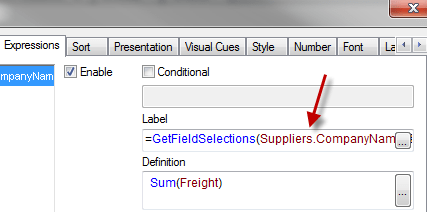
when you click on explore (…) next to the label, the complete expression looks like
=GetFieldSelections(Suppliers.CompanyName)& ‘ – Freight’
Now when user selects the value in the ListBox for Supplier Company, your chart expression label/titile will display the name of the Supplier Company, like the following

- When User selects specific Supplier Company in the List box, the title/Label of the expression changes dynamically.
In the above examples, you might have noticed that dynamic titles are tied to the fields you select i.e. Year or Supplier company. How about making the title dynamic so that instead of displaying just one list box selection,it should display all the selections made by the user.
To acheive this you will use GetCurrentSelections function
GetCurrentSelections() to display all the selections made by the user. | and = symbols are used as record separator and Tag Separator
After using GetCurrentSelection() your chart will display as below

These are some of the ways in which you can display Charts title and expression label dynamically.


 :
: